

Resources Menu
What you will find as you navigate the Grid 100 or Focus 15 is a list of Index Columns for each market security.
These Index Columns are accessible, and enter into your full view when you either click on an Industry Icon or hover your mouse pointer over the industry group icon, and then selecting either open all group data or open all symbol data for a select security name.
Sample Index Columns
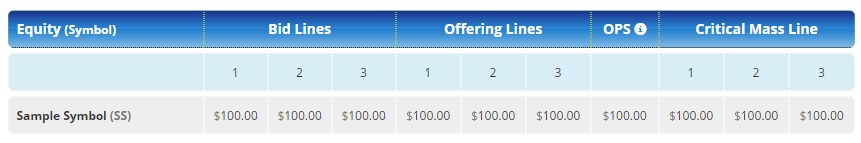
You will notice that there are three price levels (depending on market relevance, only one or two levels will be listed) listed for Bid-Lines, Offering Lines, and Critical Mass Lines.
NOTE: If fields are marked as N/A, it means that Running Alpha is crunching numbers behind the scenes to give you access to the most relevant intelligence. Even in such situations where no index field are applicable, so long as the AlphaIdeaGrid — Grid 100 and Focus 15 Heat Maps — is signaling strong forward sentiment guidance in specific securities, those are the only names you should start putting on your alpha radar and watching closely for favorable future market action, and particularly so upon the arrival of incoming positive news and market events.
How many times have you seen good news ignored by the market, only to watch other stocks that you do not own climb higher. This is precisely the problem the AlphaIdeaGrid — Grid 100 and Focus 15 — attacks head on; so by augmenting your current knowledge of the prospects for positive corporate announcements and economic reports, you should start finding yourself pleasantly surprised by the degree to which positive events translate into highly favorable asset price performance outcomes.
When the Bid and Offering lines are applicable, they indicate the price levels where bullish traders ( refer to bid lines ) and bearish traders ( refer to offering lines ) are likely going to try defending their positions and market views, in the event that the symbol’s equity price tests those levels. The Bid lines serve as potential support in the event of acute market pullbacks, and the Offering Lines act as potential pits-stops along the way.
These interim levels should not to be construed as chronic intermediate or long-term reversal points; however, in those times when the risk of a pullback from offering levels becomes heightened, the Momentum Flag icon is intended for offering you early clues as to when sentiment momentum in the short term may soon be waning. This is important, because, while many investment and trading strategies can get you into a trade that moves in your favor initially, they often disappoint later by giving up a great deal of your reward, particularly when lower levels of usually unseen forward sentiment bias starts resetting stretched valuations suddenly and without clear warning of material market distribution patterns. Under these scenarios, many traditional strategies have trouble coping with catching market reversal signals; lacking sufficient lead time for discovering when the next set of open-market offers will begin hammering the market — thus, making it harder for you to keep your profits.
To address this challenge and kick your trading plan into higher gear, especially in volatile environments of elevated uncertainty, Running Alpha introduced the Momentum Flag — a sort of traffic light that turns to and from Red, Amber to Green, when the market begins telegraphing that future sentiment is shifting into varying degrees of bias; indicating when you should be: (i) putting together your portfolio shopping list; (ii) paying close attention to your core-portfolio holdings, particularly those selected from among the Grid 100 or Focus 15; and (iii) addressing more active and frequent opportunities for trading around core positions.
OPS is an acronym for Origin of Positive Sentiment — this index column refers to the initial price zone that was cleared on the up-side for opening up discussion of longer term and more sustainable bullish activity.
Last, but not least, the Critical Mass Lines are designed to tell you about those really big and important levels, where the sentiment and trend dynamics shift regimes from cyclical to secular cycles. Whether you are a long term investor that likes sailing with the tide of long term growth, or a value investor who wants to avoid value traps, or even an active trader that is looking for guidance in keeping out of aggressive short positions during times of structural shifts in market sentiment, knowing which side of the Critical Mass Lines your holdings rest is key.
To learn more about index columns and see what they are saying about tomorrow’s most important trends in high-impact markets, please sign up for access today.